Prometheus excels in open-source monitoring with robust time-series data collection and flexible querying through PromQL, making it ideal for complex, custom cloud-native environments. Datadog offers an all-in-one SaaS solution with extensive integrations, user-friendly dashboards, and AI-driven insights for faster troubleshooting and real-time alerting. Choosing between Prometheus and Datadog depends on whether an organization prioritizes control and customization or ease of use and comprehensive managed services.
Table of Comparison
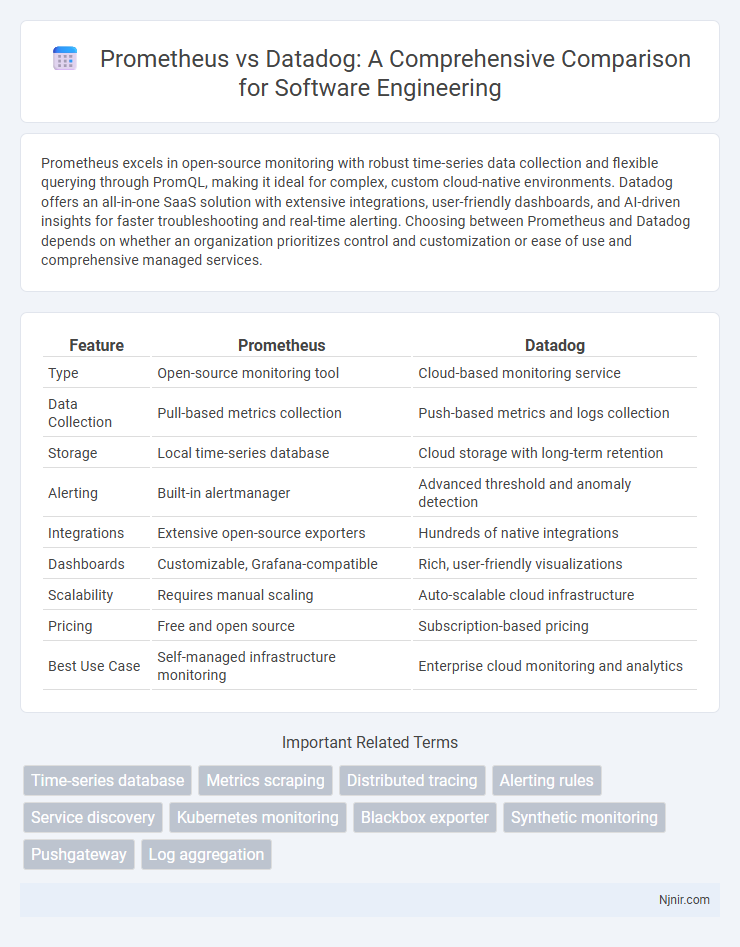
| Feature | Prometheus | Datadog |
|---|---|---|
| Type | Open-source monitoring tool | Cloud-based monitoring service |
| Data Collection | Pull-based metrics collection | Push-based metrics and logs collection |
| Storage | Local time-series database | Cloud storage with long-term retention |
| Alerting | Built-in alertmanager | Advanced threshold and anomaly detection |
| Integrations | Extensive open-source exporters | Hundreds of native integrations |
| Dashboards | Customizable, Grafana-compatible | Rich, user-friendly visualizations |
| Scalability | Requires manual scaling | Auto-scalable cloud infrastructure |
| Pricing | Free and open source | Subscription-based pricing |
| Best Use Case | Self-managed infrastructure monitoring | Enterprise cloud monitoring and analytics |
Introduction to Prometheus and Datadog
Prometheus is an open-source monitoring system renowned for its powerful time-series database and flexible query language, designed to collect and store metrics in real-time for cloud-native environments. Datadog is a comprehensive SaaS-based monitoring and analytics platform that integrates infrastructure monitoring, application performance monitoring, and log management into a unified solution. Both tools excel in observability but differ in deployment models, with Prometheus offering self-hosted control and Datadog providing managed services with extensive built-in integrations.
Core Features Comparison
Prometheus offers robust multi-dimensional time-series data collection with a powerful query language (PromQL) optimized for real-time alerting and monitoring in dynamic environments. Datadog excels with its integrated full-stack observability platform, combining metrics, traces, and logs along with machine learning-driven anomaly detection and seamless third-party integrations. Both solutions provide scalable monitoring capabilities, but Prometheus prioritizes open-source customization and granular metric collection, while Datadog delivers a comprehensive SaaS experience with enhanced visualization and collaboration tools.
Data Collection and Storage Architecture
Prometheus utilizes a pull-based data collection model, scraping metrics endpoints at defined intervals, enabling efficient time-series data gathering with built-in dimensional data via labels. Its storage architecture is local, using a custom time-series database optimized for high ingestion rates and compression, with optional remote storage integrations for long-term retention. Datadog employs an agent-based push model, collecting data from various sources including logs, metrics, and traces, and stores it in a fully managed cloud infrastructure with scalable, multi-tenant storage designed for real-time analysis and long-term durability.
Metrics Querying and Visualization
Prometheus offers a powerful multidimensional data model with a flexible query language called PromQL, which enables precise and complex metrics querying tailored for monitoring containerized environments. Datadog provides an intuitive, user-friendly interface with built-in dashboards and advanced visualization options, allowing rapid customization and correlation across metrics, traces, and logs. While Prometheus excels in open-source metric collection and querying scalability, Datadog enhances visualization through seamless integration with AWS, Kubernetes, and other cloud services for comprehensive observability.
Alerting Capabilities
Prometheus offers powerful alerting capabilities through its Alertmanager, enabling users to create complex alerting rules based on time series data with high customizability and efficient integration with various notification channels like email, Slack, and PagerDuty. Datadog provides an intuitive alerting system with machine learning-driven anomaly detection, real-time alerts, and multi-channel notifications, enhancing proactive incident management across cloud environments and infrastructure. Both tools support rich metric collection, but Datadog's unified platform simplifies managing alerts alongside logs and traces, while Prometheus excels in open-source flexibility and on-premises deployments.
Integration and Ecosystem Support
Prometheus offers native integration with Kubernetes and a wide array of open-source exporters, enabling extensive monitoring customization and ecosystem flexibility. Datadog provides seamless integration with over 500 cloud services, applications, and infrastructure tools, backed by robust API support for data ingestion and interaction. The expansive plugin ecosystem of Datadog supports comprehensive monitoring, while Prometheus excels in cloud-native environments with strong community-driven exporter development.
Scalability and Performance
Prometheus excels in scalability through its pull-based architecture and efficient time-series database, making it ideal for large Kubernetes environments with high cardinality metrics. Datadog offers robust scalability via a fully managed SaaS platform capable of ingesting massive volumes of data with minimal latency, supporting real-time alerting and dashboards across global infrastructures. Performance-wise, Prometheus provides fast query execution optimized by its PromQL engine, while Datadog leverages distributed data collection agents and cloud-native processing to maintain low overhead and high availability.
Pricing and Licensing
Prometheus operates as an open-source monitoring system, offering free usage without licensing fees, making it cost-effective for organizations with in-house expertise to manage infrastructure and scaling. Datadog provides a subscription-based pricing model, typically charging per host or user, with tiered plans that include various features such as infrastructure monitoring, application performance monitoring, and log management, which can lead to higher operational expenses for large-scale deployments. Evaluating total cost of ownership involves considering Prometheus' resource requirements and integration efforts against Datadog's all-in-one platform convenience and support services.
Security and Compliance
Prometheus offers robust security features through client-side encryption, role-based access control (RBAC), and integration with Prometheus Alertmanager for secure alert routing, ensuring compliance with data privacy standards. Datadog provides comprehensive compliance tools, including out-of-the-box support for HIPAA, SOC 2, GDPR, and PCI-DSS, combined with end-to-end encryption and granular access controls to protect sensitive data. Both platforms enable audit logging and monitoring, but Datadog's compliance certifications and comprehensive security management suit enterprises with stringent regulatory requirements.
Pros, Cons, and Use Case Recommendations
Prometheus excels in open-source monitoring with powerful multi-dimensional data modeling and querying via PromQL, making it ideal for cloud-native environments and Kubernetes metrics collection; however, it requires manual setup and lacks native long-term storage and alerting robustness. Datadog offers an all-in-one monitoring platform with integrated log management, AI-driven alerts, and seamless integration across cloud services, providing ease of use and scalability for enterprises but comes with higher costs and vendor lock-in risks. Choose Prometheus for cost-effective, customizable monitoring in containerized infrastructures, while Datadog suits organizations needing comprehensive observability with minimal operational overhead.
Time-series database
Prometheus offers a highly efficient, open-source time-series database designed for real-time monitoring with multi-dimensional data model and flexible query language, while Datadog provides a scalable, cloud-based time-series database integrated with comprehensive observability and AI-driven analytics platforms.
Metrics scraping
Prometheus excels in metrics scraping with its pull-based model and native support for multi-dimensional data collection, while Datadog employs an agent-based push model that simplifies integration but may introduce latency and scaling challenges.
Distributed tracing
Prometheus primarily specializes in metrics collection and monitoring, lacking built-in distributed tracing capabilities which Datadog offers as a comprehensive solution with integrated distributed tracing, metrics, and log management for enhanced observability in microservices environments.
Alerting rules
Prometheus offers highly flexible, customizable alerting rules based on PromQL queries ideal for granular monitoring, while Datadog provides user-friendly, pre-configured alerts with integrated machine learning for anomaly detection suitable for rapid deployment.
Service discovery
Prometheus excels in dynamic service discovery with native support for multiple cloud platforms and custom service registries, while Datadog primarily relies on agent-based automatic discovery integrated with its broader monitoring ecosystem.
Kubernetes monitoring
Prometheus offers highly customizable, open-source Kubernetes monitoring with powerful, flexible query capabilities, while Datadog provides a comprehensive, integrated SaaS solution featuring automated Kubernetes cluster monitoring, real-time analytics, and seamless cloud-native environment integration.
Blackbox exporter
Prometheus Blackbox Exporter provides targeted, customizable probing of network endpoints for detailed uptime and latency metrics, while Datadog offers integrated, user-friendly monitoring with broad infrastructure visibility but less specialized blackbox probing capabilities.
Synthetic monitoring
Prometheus offers open-source synthetic monitoring with customizable metrics collection, while Datadog provides comprehensive synthetic monitoring through automated API tests, browser tests, and real-time analytics in an integrated SaaS platform.
Pushgateway
Prometheus relies on Pushgateway to handle short-lived jobs with ephemeral metrics, whereas Datadog natively supports direct metric ingestion without requiring a push gateway intermediary.
Log aggregation
Prometheus excels in time-series metrics monitoring but lacks native log aggregation features, whereas Datadog offers comprehensive log aggregation with real-time analysis and seamless integration across metrics, traces, and logs.
Prometheus vs Datadog Infographic