Prometheus excels in real-time monitoring and alerting by efficiently collecting and storing time-series data with a powerful query language, PromQL. Grafana complements Prometheus by providing rich visualization options and customizable dashboards, enabling users to interpret complex metrics with ease. Together, Prometheus handles data ingestion and alerting while Grafana enhances data presentation for comprehensive software performance analysis.
Table of Comparison
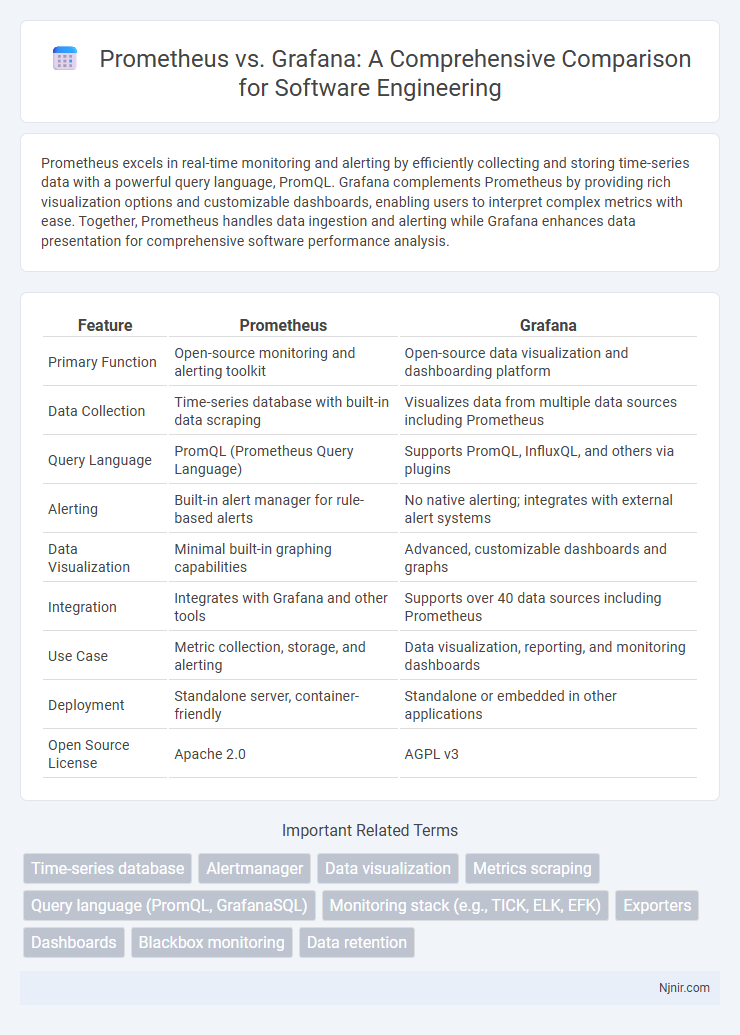
| Feature | Prometheus | Grafana |
|---|---|---|
| Primary Function | Open-source monitoring and alerting toolkit | Open-source data visualization and dashboarding platform |
| Data Collection | Time-series database with built-in data scraping | Visualizes data from multiple data sources including Prometheus |
| Query Language | PromQL (Prometheus Query Language) | Supports PromQL, InfluxQL, and others via plugins |
| Alerting | Built-in alert manager for rule-based alerts | No native alerting; integrates with external alert systems |
| Data Visualization | Minimal built-in graphing capabilities | Advanced, customizable dashboards and graphs |
| Integration | Integrates with Grafana and other tools | Supports over 40 data sources including Prometheus |
| Use Case | Metric collection, storage, and alerting | Data visualization, reporting, and monitoring dashboards |
| Deployment | Standalone server, container-friendly | Standalone or embedded in other applications |
| Open Source License | Apache 2.0 | AGPL v3 |
Introduction to Prometheus and Grafana
Prometheus is an open-source systems monitoring and alerting toolkit designed for reliability and scalability, specializing in time-series data collection with a powerful query language called PromQL. Grafana is an open-source analytics and interactive visualization web application that integrates with various data sources, including Prometheus, to create customizable dashboards for monitoring metrics. Together, Prometheus provides the data storage and alerting capabilities, while Grafana offers intuitive visualization and real-time insights into system performance.
Core Features Comparison
Prometheus specializes in powerful time-series data collection and alerting with a multi-dimensional data model and a flexible query language called PromQL, making it ideal for real-time monitoring and alerting. Grafana excels in data visualization, offering rich, customizable dashboards and support for multiple data sources, including Prometheus, to create interactive and insightful graphics. Together, Prometheus handles metric storage and alerting, while Grafana provides the visual interface for analyzing and displaying those metrics effectively.
Architecture Overview
Prometheus features a multi-dimensional data model with time series identified by metric name and key-value pairs, relying on a pull-based scraping mechanism for data collection and a local storage system optimized for time series data. Grafana acts as a visualization and analytics platform that integrates with Prometheus as a primary data source, leveraging its query language, PromQL, to build customizable and interactive dashboards. Together, Prometheus handles efficient data monitoring and alerting, while Grafana provides advanced visualization capabilities for real-time and historical data analysis.
Data Collection and Storage
Prometheus excels in data collection by efficiently scraping real-time metrics from configured targets using a pull model, storing time-series data locally in its optimized custom storage format. Grafana, on the other hand, acts primarily as a visualization and analytics platform, aggregating data from multiple sources including Prometheus but does not collect or store data independently. Prometheus's built-in storage is tailored for high-resolution monitoring data retention, whereas Grafana integrates with external databases or time-series data stores to provide flexible, multi-source data visualization.
Query Language and Flexibility
Prometheus uses PromQL, a powerful and expressive query language designed specifically for time-series data, enabling complex filtering, aggregation, and mathematical operations natively within the monitoring system. Grafana, while not a data source itself, supports multiple query languages including PromQL, SQL, and Loki's LogQL, offering greater flexibility in querying diverse data sources through a unified visualization platform. This multi-language support and extensible plugin architecture make Grafana highly adaptable for varied monitoring scenarios beyond Prometheus metrics alone.
Visualization Capabilities
Grafana excels in visualization capabilities by offering a wide range of customizable and interactive dashboards that support various data sources, including Prometheus. Prometheus specializes in data collection and storage but relies on Grafana for advanced visualization features such as heatmaps, histograms, and real-time graphing. The seamless integration between Prometheus' robust metrics gathering and Grafana's rich visualization tools creates an effective monitoring solution for complex systems.
Integration and Extensibility
Prometheus excels in data collection and storage with its powerful multi-dimensional time series database, while Grafana specializes in visualization by integrating seamlessly with Prometheus to create dynamic, customizable dashboards. Prometheus offers extensive support for scraping metrics from various services via exporters and a robust query language (PromQL), enabling granular data analysis. Grafana enhances extensibility through a wide range of plugins that support multiple data sources beyond Prometheus, allowing users to tailor monitoring solutions across diverse environments.
Use Cases in Software Engineering
Prometheus excels in monitoring and alerting for time-series data, making it ideal for performance metrics collection, anomaly detection, and ensuring application reliability in microservices environments. Grafana complements Prometheus by providing advanced visualization capabilities, enabling software engineers to create interactive dashboards for real-time data analysis and troubleshooting. Together, they streamline continuous integration and delivery pipelines by offering comprehensive observability and faster incident response.
Performance and Scalability
Prometheus excels in high-performance metric collection with a multi-dimensional data model and efficient time-series storage, making it ideal for real-time monitoring in dynamic environments. Grafana, designed primarily for visualization, supports scalable data querying across various backends, including Prometheus, enabling efficient analysis of large datasets from multiple sources. Combining Prometheus for data capture and Grafana for visualization offers a robust, scalable monitoring solution optimized for performance in complex infrastructures.
Choosing the Right Tool for Your Needs
Prometheus excels in robust time-series data collection and real-time alerting, making it ideal for monitoring system metrics and infrastructure performance. Grafana specializes in rich, customizable data visualization, enabling users to create detailed dashboards by integrating multiple data sources, including Prometheus. Selecting the right tool depends on your primary goals: choose Prometheus for efficient data gathering and alert management, and Grafana for advanced visual insights and dashboard creation.
Time-series database
Prometheus excels as a time-series database optimized for real-time monitoring and alerting, while Grafana specializes in visualizing time-series data from multiple sources, including Prometheus.
Alertmanager
Prometheus Alertmanager excels in managing alerts by deduplicating, grouping, and routing notifications, while Grafana integrates Alertmanager to visualize and customize alerts within unified dashboards.
Data visualization
Grafana offers advanced, customizable data visualization dashboards that integrate seamlessly with Prometheus' robust time-series data collection and querying capabilities for real-time monitoring.
Metrics scraping
Prometheus excels in metrics scraping with its powerful, flexible pull-based model and native support for multi-dimensional data collection, while Grafana specializes in visualizing metrics but relies on external data sources like Prometheus for scraping and storage.
Query language (PromQL, GrafanaSQL)
Prometheus uses PromQL, a powerful query language designed for time-series data and alerting, while Grafana supports GrafanaSQL, a flexible query language that enables complex data visualization across multiple data sources.
Monitoring stack (e.g., TICK, ELK, EFK)
Prometheus excels in time-series data collection and alerting within monitoring stacks like TICK and EFK, while Grafana specializes in visualizing metrics from Prometheus, ELK, and other data sources for comprehensive observability.
Exporters
Prometheus relies on exporters to collect metrics from various systems and applications, while Grafana primarily serves as a visualization tool that integrates with Prometheus and its exporters to display real-time monitoring data.
Dashboards
Grafana provides highly customizable and interactive dashboards for visualizing Prometheus metrics, enabling real-time monitoring and detailed analysis through various chart types, alerts, and data source integrations.
Blackbox monitoring
Prometheus excels at Blackbox monitoring by efficiently collecting and storing time-series metrics from external endpoints using exporters, while Grafana provides powerful visualization and dashboarding capabilities to analyze and display these Blackbox probe results.
Data retention
Prometheus offers limited data retention typically set by local storage duration configurations, while Grafana depends on connected data sources for extended data retention and offers customizable long-term storage through plugins and integrations.
Prometheus vs Grafana Infographic