OpenTelemetry provides a comprehensive framework for collecting distributed traces, metrics, and logs, enabling end-to-end observability across complex software systems. Prometheus specializes in time-series metrics monitoring with powerful querying capabilities, making it ideal for system performance analysis and alerting. Combining OpenTelemetry's instrumentation with Prometheus's metric storage enhances the observability stack by delivering richer insights into application behavior and infrastructure health.
Table of Comparison
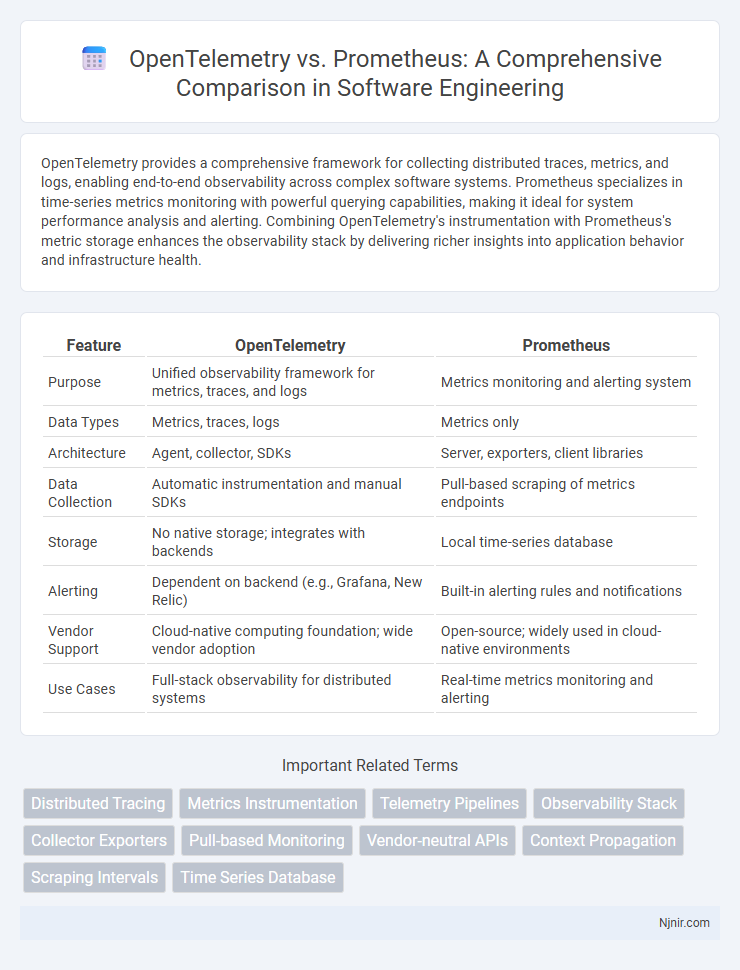
| Feature | OpenTelemetry | Prometheus |
|---|---|---|
| Purpose | Unified observability framework for metrics, traces, and logs | Metrics monitoring and alerting system |
| Data Types | Metrics, traces, logs | Metrics only |
| Architecture | Agent, collector, SDKs | Server, exporters, client libraries |
| Data Collection | Automatic instrumentation and manual SDKs | Pull-based scraping of metrics endpoints |
| Storage | No native storage; integrates with backends | Local time-series database |
| Alerting | Dependent on backend (e.g., Grafana, New Relic) | Built-in alerting rules and notifications |
| Vendor Support | Cloud-native computing foundation; wide vendor adoption | Open-source; widely used in cloud-native environments |
| Use Cases | Full-stack observability for distributed systems | Real-time metrics monitoring and alerting |
Overview: OpenTelemetry vs Prometheus
OpenTelemetry provides a comprehensive framework for collecting, processing, and exporting telemetry data, including traces, metrics, and logs, enabling unified observability across distributed systems. Prometheus specializes in metrics collection and monitoring, featuring a powerful time-series database, a flexible query language (PromQL), and alerting capabilities primarily for infrastructure and applications. While OpenTelemetry emphasizes vendor-neutral, end-to-end telemetry instrumentation, Prometheus focuses on robust, real-time metrics monitoring within cloud-native environments.
Core Features Comparison
OpenTelemetry offers comprehensive observability by integrating traces, metrics, and logs into a unified platform, supporting diverse instrumentation libraries and export formats. Prometheus specializes in metrics collection with a powerful time-series database and a flexible query language, PromQL, optimized for monitoring and alerting. While OpenTelemetry provides broad ecosystem compatibility and vendor-neutral instrumentation, Prometheus excels in real-time monitoring and has a robust alerting system tailored for cloud-native environments.
Architecture and Data Collection
OpenTelemetry employs a unified architecture combining tracing, metrics, and logs through language-specific SDKs and exporters to various backends, enabling comprehensive observability. Prometheus utilizes a pull-based data collection model primarily focusing on time-series metrics, with a multi-dimensional data model and a built-in query language (PromQL) for real-time monitoring. OpenTelemetry's collector provides flexibility in data ingestion and export, whereas Prometheus emphasizes direct, efficient metric scraping from instrumented endpoints.
Supported Metrics and Tracing Capabilities
OpenTelemetry supports a wide range of metrics including counters, gauges, and histograms, alongside robust distributed tracing capabilities that enable detailed context propagation and correlation across microservices. Prometheus specializes in time-series metrics collection and querying with powerful multi-dimensional data models but lacks native support for distributed tracing, requiring integration with external tracing systems. The combined use of OpenTelemetry for tracing and Prometheus for metrics provides comprehensive observability across modern cloud-native environments.
Integration with Existing Systems
OpenTelemetry offers extensive support for integration with modern cloud-native environments and existing monitoring tools by providing standardized instrumentation libraries and exporters compatible with Prometheus, Jaeger, and other observability backends. Prometheus excels in seamless integration with Kubernetes and cloud-native ecosystems through its native scraping mechanism and support for various service discovery methods, enabling real-time metrics collection without complex configuration. Both tools complement each other, with OpenTelemetry enhancing observability through traces and logs while Prometheus specializes in high-resolution metrics monitoring.
Scalability and Performance
OpenTelemetry offers flexible scalability by supporting multiple telemetry data types--metrics, traces, and logs--across distributed systems, enabling efficient data collection and export to various backends. Prometheus is highly performant for time-series metrics, optimized for single-node monitoring with robust querying but faces challenges scaling horizontally in large, distributed environments without additional components like Thanos or Cortex. Combining OpenTelemetry's versatile instrumentation with Prometheus' specialized metrics storage can achieve scalable observability with high performance in complex infrastructures.
Ecosystem and Community Support
OpenTelemetry benefits from a rapidly growing ecosystem with strong backing from major cloud providers and observability platforms, fostering broad integration and extensive instrumentation support. Prometheus has a mature and robust community with a vast array of exporters, alerting tools, and dashboards, making it a de facto standard for Kubernetes monitoring. Both projects offer active contributions and extensive documentation, but OpenTelemetry's multi-signal telemetry approach attracts a more diverse contributor base across tracing, metrics, and logs.
Use Cases and Best Practices
OpenTelemetry excels in providing a unified observability framework that integrates metrics, traces, and logs, making it ideal for modern microservices and distributed systems requiring comprehensive telemetry data collection. Prometheus specializes in time-series metrics monitoring with powerful query capabilities, best suited for real-time alerting and performance monitoring of containerized applications and infrastructure. Combining OpenTelemetry for data ingestion and Prometheus for metrics storage and alerting follows best practices to leverage their strengths in observability pipelines.
Pros and Cons Analysis
OpenTelemetry offers a comprehensive, vendor-neutral observability framework integrating traces, metrics, and logs, facilitating seamless context propagation and rich telemetry data collection. Prometheus excels in time-series metrics monitoring with a powerful query language (PromQL) and an extensive ecosystem for alerting and visualization but lacks native distributed tracing support. Choosing between OpenTelemetry and Prometheus depends on the need for unified observability versus specialized metrics focus, with OpenTelemetry providing broader telemetry capabilities and Prometheus delivering robust, scalable metrics monitoring.
Choosing the Right Tool for Your Projects
OpenTelemetry offers a comprehensive observability framework with distributed tracing, metrics, and logs, making it ideal for complex, microservices-based architectures requiring end-to-end monitoring. Prometheus excels in real-time metrics collection and alerting, optimized for system monitoring and Kubernetes environments with its powerful querying language and ecosystem integration. Choosing between them depends on project needs: use OpenTelemetry for holistic observability across diverse telemetry data, and Prometheus for efficient, scalable metrics-focused monitoring and alerting.
Distributed Tracing
OpenTelemetry provides comprehensive distributed tracing with standardized instrumentation and context propagation, while Prometheus primarily focuses on metric collection and requires integration with tools like Jaeger or Zipkin for tracing capabilities.
Metrics Instrumentation
OpenTelemetry offers a unified, vendor-neutral metrics instrumentation framework supporting multiple backend exporters, while Prometheus specializes in a robust, open-source metrics collection and alerting system with a powerful query language.
Telemetry Pipelines
OpenTelemetry offers a unified telemetry pipeline with standardized instrumentation and protocol support, while Prometheus specializes in time-series metrics collection with strong querying but requires additional components for full telemetry pipeline integration.
Observability Stack
OpenTelemetry provides a unified observability stack by enabling standardized instrumentation for metrics, traces, and logs, while Prometheus specializes in robust metric collection and alerting within cloud-native monitoring environments.
Collector Exporters
OpenTelemetry Collector Exporters provide flexible, vendor-neutral data pipelines supporting metrics, logs, and traces export, while Prometheus primarily focuses on metrics scraping with limited native exporter capabilities.
Pull-based Monitoring
OpenTelemetry supports pull-based monitoring by integrating with Prometheus exporters that expose metrics endpoints for Prometheus to scrape, enabling flexible and scalable observability.
Vendor-neutral APIs
OpenTelemetry provides vendor-neutral APIs for collecting distributed traces and metrics, whereas Prometheus primarily focuses on a vendor-neutral metrics scraping model without integrated tracing support.
Context Propagation
OpenTelemetry excels in context propagation by providing standardized, vendor-neutral APIs and SDKs for distributed tracing across microservices, whereas Prometheus primarily focuses on metrics collection and lacks built-in support for context propagation in distributed systems.
Scraping Intervals
OpenTelemetry supports customizable scraping intervals for data collection, while Prometheus defaults to a 15-second scrape interval that can be adjusted for more granular or less frequent monitoring.
Time Series Database
OpenTelemetry provides a vendor-agnostic framework for collecting telemetry data, while Prometheus includes a built-in time series database optimized for real-time metrics storage and querying.
OpenTelemetry vs Prometheus Infographic