Chemometrics applies multivariate statistical techniques to extract relevant information from complex chemical data sets, enhancing decision-making and process optimization in chemical engineering. Spectroscopy provides a direct, non-destructive analytical method by measuring the interaction of electromagnetic radiation with matter to identify chemical composition and structure. Integrating chemometrics with spectroscopy enables more accurate interpretation of spectral data, improving sensitivity and specificity in chemical analysis.
Table of Comparison
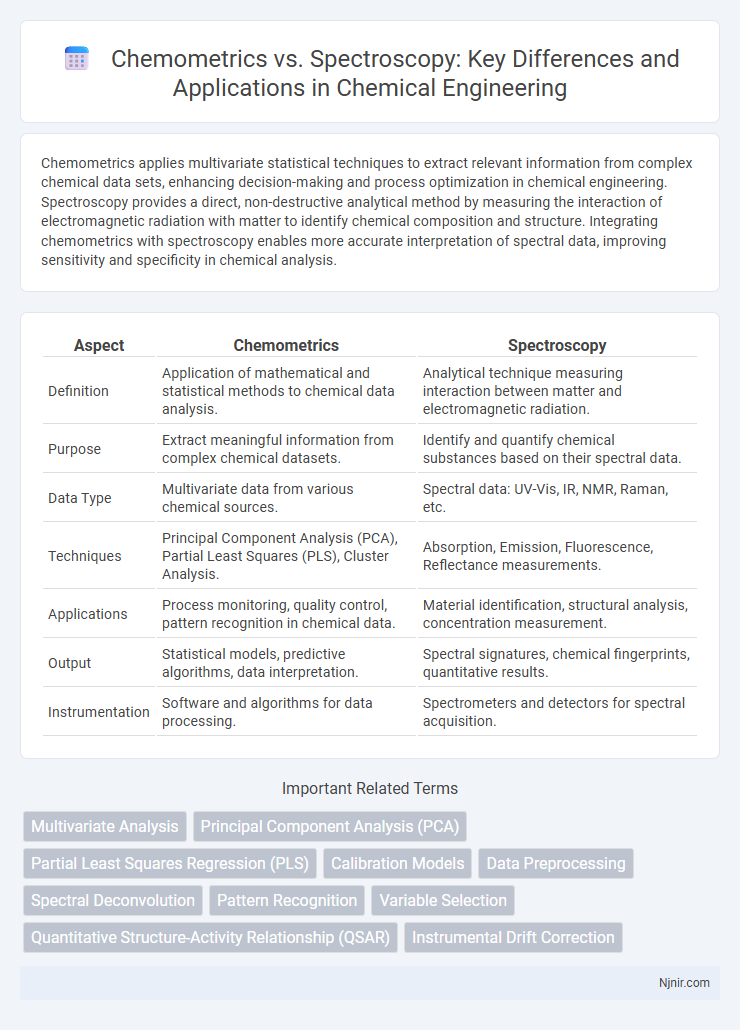
| Aspect | Chemometrics | Spectroscopy |
|---|---|---|
| Definition | Application of mathematical and statistical methods to chemical data analysis. | Analytical technique measuring interaction between matter and electromagnetic radiation. |
| Purpose | Extract meaningful information from complex chemical datasets. | Identify and quantify chemical substances based on their spectral data. |
| Data Type | Multivariate data from various chemical sources. | Spectral data: UV-Vis, IR, NMR, Raman, etc. |
| Techniques | Principal Component Analysis (PCA), Partial Least Squares (PLS), Cluster Analysis. | Absorption, Emission, Fluorescence, Reflectance measurements. |
| Applications | Process monitoring, quality control, pattern recognition in chemical data. | Material identification, structural analysis, concentration measurement. |
| Output | Statistical models, predictive algorithms, data interpretation. | Spectral signatures, chemical fingerprints, quantitative results. |
| Instrumentation | Software and algorithms for data processing. | Spectrometers and detectors for spectral acquisition. |
Introduction to Chemometrics and Spectroscopy
Chemometrics involves the application of mathematical and statistical methods to extract relevant information from chemical data, enhancing the analysis and interpretation of complex datasets. Spectroscopy refers to techniques that measure the interaction between electromagnetic radiation and matter to identify molecular composition and structure. Combining chemometrics with spectroscopy improves data accuracy and predictive modeling in chemical analysis.
Fundamental Principles of Chemometrics
Chemometrics involves the application of mathematical and statistical techniques to optimize the extraction of relevant chemical information from complex data sets, often enhancing analytical accuracy and interpretation. It employs multivariate analysis, pattern recognition, and calibration methods to relate spectral data to chemical properties or concentrations. Unlike spectroscopy, which primarily focuses on the measurement of light-matter interactions, chemometrics transforms raw spectral data into actionable insights through data modeling and computational algorithms.
Core Concepts in Spectroscopy
Spectroscopy involves the study of the interaction between electromagnetic radiation and matter to analyze the composition and properties of substances, relying on techniques such as infrared, ultraviolet-visible, and nuclear magnetic resonance spectroscopy. Core concepts include wavelength, frequency, absorbance, emission, and molecular energy transitions, which provide critical insights into molecular structure and concentration. Chemometrics complements spectroscopy by applying multivariate statistical methods to interpret complex spectral data, enhancing accuracy and predictive power in chemical analysis.
Key Differences Between Chemometrics and Spectroscopy
Chemometrics involves the application of mathematical and statistical techniques to analyze and interpret complex chemical data, while spectroscopy focuses on measuring the interaction between matter and electromagnetic radiation. Spectroscopy generates raw spectral data from samples, and chemometrics processes this data to extract meaningful patterns, improve accuracy, and enhance decision-making. Key differences include spectroscopy as a data acquisition method and chemometrics as a data analysis tool that enables quantitative and qualitative interpretation of spectral results.
Integration of Chemometrics in Spectroscopic Analysis
Chemometrics enhances spectroscopic analysis by applying advanced statistical and mathematical techniques to interpret complex spectral data, improving accuracy and sensitivity. Its integration enables the extraction of relevant chemical information from overlapping signals and noise in various spectroscopic methods such as NIR, Raman, and UV-Vis spectroscopy. This synergy facilitates multivariate calibration, classification, and pattern recognition, crucial for precise qualitative and quantitative chemical analysis.
Applications in Chemical Engineering
Chemometrics enhances spectroscopy by applying statistical and mathematical techniques to extract meaningful information from complex spectral data, improving process monitoring and control in chemical engineering. Spectroscopy provides real-time analysis of chemical composition and molecular structures critical for reaction optimization, quality assurance, and material characterization. Combining chemometrics with spectroscopy enables more accurate predictive modeling and fault detection in chemical manufacturing processes.
Data Processing and Analysis Techniques
Chemometrics involves the application of advanced multivariate statistical methods to extract relevant chemical information from complex spectral data, enhancing the interpretation and prediction capabilities of spectroscopy analyses. Spectroscopy produces raw spectral data through the interaction of light with matter, requiring sophisticated data pre-processing techniques such as baseline correction, normalization, and noise reduction before chemometric models like Principal Component Analysis (PCA) or Partial Least Squares Regression (PLSR) can be applied. Data processing in chemometrics transforms spectral variables into actionable insights, enabling chemical classification, quantification, and pattern recognition beyond traditional univariate spectral analysis.
Advantages and Limitations
Chemometrics enhances spectroscopy by applying advanced statistical and mathematical techniques to extract meaningful information from complex spectral data, improving accuracy and predictive power in chemical analysis. Spectroscopy offers rapid, non-destructive measurement of molecular and atomic properties but often suffers from overlapping signals and matrix interferences that complicate direct interpretation. Combining chemometrics with spectroscopy overcomes many limitations by enabling deconvolution of complex spectra and robust calibration models, though it requires expertise in data analysis and high-quality reference datasets to avoid overfitting and misinterpretation.
Case Studies in Industry
Case studies in the pharmaceutical and food industries reveal Chemometrics enhances Spectroscopy by enabling more accurate interpretation of complex spectral data, leading to improved quality control and process optimization. In chemical manufacturing, integration of Chemometrics with Near-Infrared Spectroscopy (NIR) facilitates real-time monitoring of product composition, reducing waste and increasing efficiency. Petrochemical case studies demonstrate that multivariate analysis techniques from Chemometrics applied to Spectroscopy data provide predictive insights for refining processes and sensor calibration.
Future Trends and Developments
Future trends in chemometrics emphasize the integration of advanced machine learning algorithms to enhance data interpretation, driving more accurate predictive models in complex spectral analysis. Spectroscopy is evolving with innovations such as hyperspectral imaging and real-time spectral data acquisition, enabling deeper, faster insights across pharmaceutical and environmental applications. The convergence of chemometric techniques with next-generation spectroscopic instrumentation promises improved automation, robustness, and scalability in analytical workflows.
Multivariate Analysis
Multivariate analysis in chemometrics enhances spectroscopy by extracting meaningful patterns from complex spectral data to improve classification, calibration, and prediction accuracy.
Principal Component Analysis (PCA)
Principal Component Analysis (PCA) is a key chemometric technique used in spectroscopy to reduce dimensionality, enhance data interpretation, and identify underlying patterns in complex spectral datasets.
Partial Least Squares Regression (PLS)
Partial Least Squares Regression (PLS) in chemometrics enhances spectroscopy analysis by modeling complex relationships between spectral data and chemical properties, improving prediction accuracy in multivariate calibration.
Calibration Models
Chemometrics enhances spectroscopy by developing robust calibration models that accurately interpret complex spectral data to quantify chemical compositions.
Data Preprocessing
Data preprocessing in chemometrics involves transforming and cleaning raw spectral data from spectroscopy techniques to enhance model accuracy and interpretability.
Spectral Deconvolution
Spectral deconvolution in spectroscopy enhances data interpretation by separating overlapping spectral signals, enabling precise chemical identification and quantification in complex mixtures.
Pattern Recognition
Pattern recognition in chemometrics leverages statistical algorithms to analyze spectral data from spectroscopy for precise chemical composition and property identification.
Variable Selection
Variable selection in chemometrics enhances spectroscopy data analysis by identifying the most informative wavelengths to improve model accuracy and reduce computational complexity.
Quantitative Structure-Activity Relationship (QSAR)
Chemometrics applies advanced statistical and mathematical techniques to interpret complex spectral data from spectroscopy, enhancing the predictive accuracy and development of Quantitative Structure-Activity Relationship (QSAR) models for drug discovery and chemical analysis.
Instrumental Drift Correction
Chemometrics enhances spectroscopy by applying advanced algorithms to correct instrumental drift, improving the accuracy and reliability of spectral data analysis.
Chemometrics vs Spectroscopy Infographic