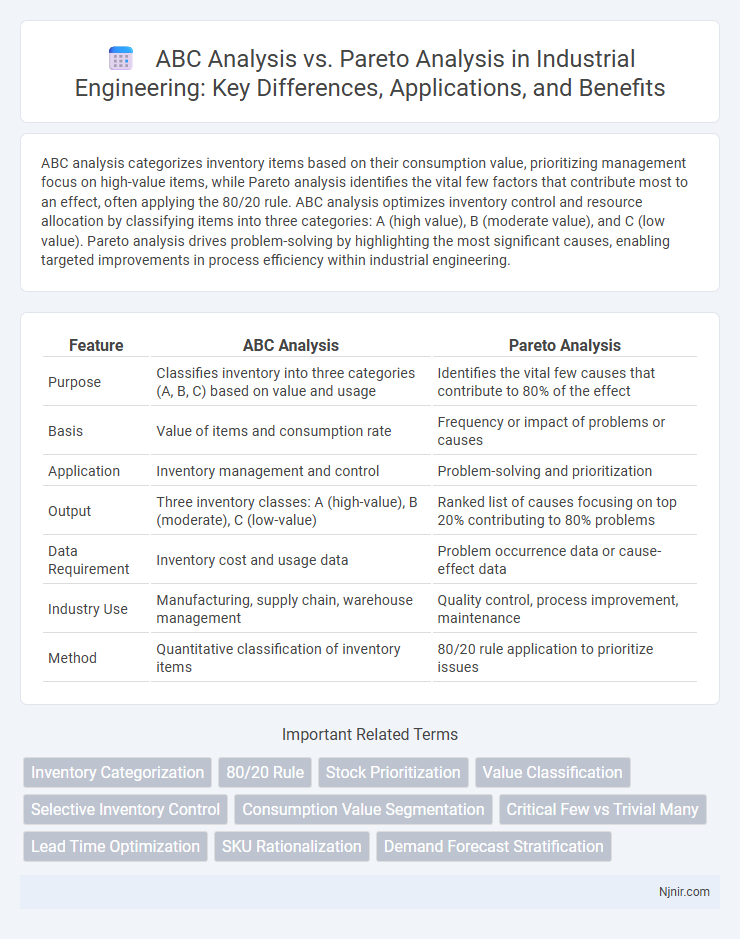
ABC analysis categorizes inventory items based on their consumption value, prioritizing management focus on high-value items, while Pareto analysis identifies the vital few factors that contribute most to an effect, often applying the 80/20 rule. ABC analysis optimizes inventory control and resource allocation by classifying items into three categories: A (high value), B (moderate value), and C (low value). Pareto analysis drives problem-solving by highlighting the most significant causes, enabling targeted improvements in process efficiency within industrial engineering.
Table of Comparison
| Feature | ABC Analysis | Pareto Analysis |
|---|---|---|
| Purpose | Classifies inventory into three categories (A, B, C) based on value and usage | Identifies the vital few causes that contribute to 80% of the effect |
| Basis | Value of items and consumption rate | Frequency or impact of problems or causes |
| Application | Inventory management and control | Problem-solving and prioritization |
| Output | Three inventory classes: A (high-value), B (moderate), C (low-value) | Ranked list of causes focusing on top 20% contributing to 80% problems |
| Data Requirement | Inventory cost and usage data | Problem occurrence data or cause-effect data |
| Industry Use | Manufacturing, supply chain, warehouse management | Quality control, process improvement, maintenance |
| Method | Quantitative classification of inventory items | 80/20 rule application to prioritize issues |
Introduction to Inventory Management Techniques
ABC analysis categorizes inventory into three classes (A, B, and C) based on their consumption value, helping prioritize management efforts on high-value items that typically represent 70-80% of the inventory value but only 10-20% of the items. Pareto analysis applies the 80/20 principle, identifying the vital few causes or items that significantly impact overall inventory cost or performance, often revealing that 20% of items contribute to 80% of inventory value or issues. Both techniques optimize inventory control by focusing resources on critical items, reducing carrying costs, and improving stock availability in inventory management systems.
Overview of ABC Analysis
ABC analysis is an inventory categorization technique that segments items into three categories--A, B, and C--based on their importance and value contribution. Category A includes high-value items that require tight control and accurate forecasting, Category B consists of moderate-value items with less frequent review, and Category C contains low-value items with minimal managerial attention. This method optimizes inventory management by focusing resources on the most critical items to improve cost efficiency and service levels.
Fundamentals of Pareto Analysis
Pareto analysis is a decision-making technique based on the 80/20 rule, which identifies that roughly 80% of effects come from 20% of causes. It prioritizes problems or tasks by focusing on the most significant factors to maximize efficiency and resource allocation. Unlike ABC analysis, which categorizes inventory or items into three classes based on value or importance, Pareto analysis emphasizes the disproportionate impact of a small number of causes on overall outcomes.
Key Differences Between ABC and Pareto Analysis
ABC analysis categorizes inventory or items into three groups (A, B, C) based on their value or importance, emphasizing resource allocation for efficient management. Pareto analysis applies the 80/20 principle, identifying the few vital items that contribute to the majority of effects or problems, focusing on prioritization to maximize impact. The key difference lies in ABC's inventory-driven classification versus Pareto's problem-solving focus on cause-effect relationships.
Applications of ABC Analysis in Industrial Engineering
ABC analysis in industrial engineering categorizes inventory into three classes based on value and usage frequency, enabling targeted control and efficient resource allocation. This method optimizes inventory management by focusing on high-value items (class A) for stringent monitoring, medium-value items (class B) with moderate control, and low-value items (class C) with simpler oversight. Unlike Pareto analysis, which identifies the most significant factors in a dataset, ABC analysis specifically aids in prioritizing inventory control to reduce costs and improve operational efficiency.
Applications of Pareto Analysis in Industrial Engineering
Pareto Analysis is widely applied in industrial engineering to identify the vital few causes that contribute to the majority of problems, optimizing resource allocation and improving process efficiency. This method helps prioritize quality control, maintenance scheduling, and inventory management by focusing on the top 20% of factors responsible for 80% of defects or delays. Compared to ABC Analysis, which classifies inventory based on value categories, Pareto Analysis emphasizes problem-solving and decision-making by revealing the most impactful issues for targeted interventions.
Advantages and Limitations of ABC Analysis
ABC analysis offers a straightforward inventory categorization method by dividing items into three classes (A, B, and C) based on their value and consumption rate, enabling focused resource allocation and optimized inventory management. It provides clear prioritization by identifying high-value items (Category A) that require stringent control, but it may overlook factors like demand variability and lead times, limiting its accuracy in dynamic environments. The simplicity of ABC analysis facilitates quick decision-making, yet its static classification can lead to suboptimal inventory levels when market conditions or item importance shift frequently.
Advantages and Limitations of Pareto Analysis
Pareto analysis excels in identifying the vital few factors contributing to the majority of problems, enabling targeted resource allocation and efficient decision-making in business and quality management. Its advantage lies in simplicity and visual clarity through Pareto charts, which prioritize issues based on frequency or impact, promoting focused improvement efforts. Limitations include reliance on historical data, potential oversimplification by ignoring interdependencies between factors, and less effectiveness in dynamic environments where priorities frequently change.
Integrating ABC and Pareto Analysis for Optimal Results
Integrating ABC analysis and Pareto analysis enhances inventory management by categorizing items based on their consumption value and identifying the vital few contributing to the majority of issues or costs. ABC analysis segments inventory into A, B, and C classes to prioritize control, while Pareto analysis highlights the 20% of items causing 80% of problems. Combining both methods enables businesses to focus on high-value items that significantly impact overall performance, optimizing resource allocation and decision-making for maximized efficiency and cost savings.
Choosing the Right Analysis Method for Industrial Operations
ABC analysis categorizes inventory based on value and consumption rates, enabling precise stock management by identifying high-priority items, while Pareto analysis highlights the vital few causes that produce the majority of problems or profits in industrial operations. Selecting ABC analysis suits businesses aiming to optimize inventory control and reduce holding costs, whereas Pareto analysis is ideal for targeting process improvements and quality control by focusing on critical factors. Effective industrial decision-making involves assessing whether inventory segmentation or problem prioritization aligns better with operational goals.
Inventory Categorization
ABC analysis categorizes inventory into three classes based on value and consumption rates, while Pareto analysis applies the 80/20 principle to identify the vital few items that contribute most significantly to inventory value or issues.
80/20 Rule
ABC analysis categorizes inventory into A, B, and C classes based on value and frequency, while Pareto analysis applies the 80/20 rule to identify the vital few causes that generate the majority of effects or problems.
Stock Prioritization
ABC analysis categorizes inventory into three classes based on consumption value to prioritize stock management, while Pareto analysis identifies the critical 20% of items causing 80% of stock value or issues, enhancing targeted inventory control.
Value Classification
ABC analysis classifies inventory based on value and consumption rate into categories A, B, and C, while Pareto analysis applies the 80/20 rule to identify the critical 20% of items contributing to 80% of the value, optimizing resource allocation and inventory management.
Selective Inventory Control
ABC analysis categorizes inventory items based on their consumption value to prioritize selective inventory control, while Pareto analysis identifies the vital few items causing most issues using the 80/20 rule to optimize inventory management.
Consumption Value Segmentation
ABC analysis segments inventory based on consumption value to prioritize management efforts, while Pareto analysis identifies the critical few items generating the majority of effects, both optimizing resource allocation in supply chain management.
Critical Few vs Trivial Many
ABC analysis prioritizes inventory management by classifying items into the Critical Few (high value) and the Trivial Many (low value), whereas Pareto analysis applies the 80/20 rule to identify the Critical Few causes responsible for the majority of effects, emphasizing resource allocation efficiency.
Lead Time Optimization
ABC analysis prioritizes inventory categorization based on value, enabling efficient lead time optimization by focusing on high-impact items, while Pareto analysis identifies the critical 20% of causes contributing to 80% of lead time delays for targeted process improvements.
SKU Rationalization
ABC analysis categorizes SKUs by inventory value to prioritize management efforts, while Pareto analysis identifies the top 20% of SKUs contributing to 80% of sales for efficient SKU rationalization.
Demand Forecast Stratification
ABC analysis categorizes inventory based on consumption value to prioritize demand forecasting, while Pareto analysis identifies the vital few demand drivers accounting for most demand variability, enhancing stratification accuracy.
ABC analysis vs Pareto analysis Infographic